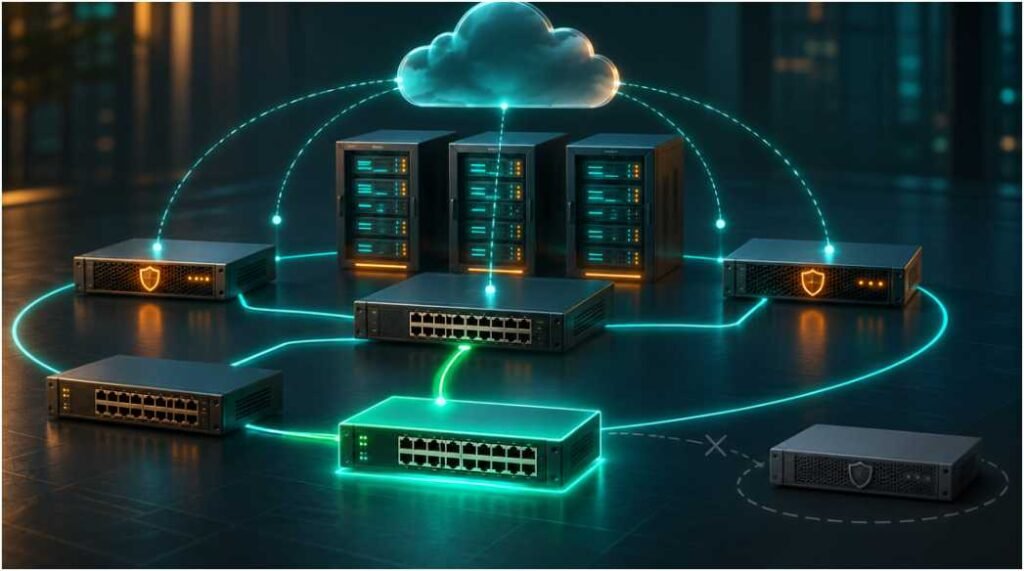
Replacing a switch or retiring a server changes what the monitoring system needs to watch. If the device inventory and coverage do not keep up, a dashboard may show an incomplete picture. Regular checks help teams confirm that the devices and connections in use are actually being monitored.
The challenge is not simply collecting more alerts. It is keeping the monitoring model accurate enough to reflect what is actually happening in the environment. A strong network monitoring platform has to do more than report on yesterday’s topology. It has to preserve context as devices change, so operators can understand what changed, what it affected, and whether the issue is local or inherited.
Why Accurate Coverage Breaks Down First
Most monitoring problems begin with assumptions that were true last month but are no longer true today. A switch is swapped, a firewall rule is modified, a VM is migrated, or a host is decommissioned. If the monitoring system does not keep pace, the team is left interpreting stale relationships and incomplete baselines.
That mismatch creates three common failures.
First, the tool may still watch the right device but miss the right context. The interface is up, yet the upstream dependency changed, so the real issue sits elsewhere.
Second, configuration drift can make alerts harder to trust. If the platform cannot show how settings have changed over time, teams spend too long asking whether a performance issue is environmental or self-inflicted.
Third, visibility becomes fragmented. A separate mapping tool, a separate configuration utility, and a separate reporting layer can each be correct in isolation, but none of them gives a unified view when the environment changes quickly.
Lumics is built around this problem. Its value is not just that it monitors devices. It keeps the operational model usable as those devices evolve.
What Strong Monitoring Systems Track Beyond Uptime
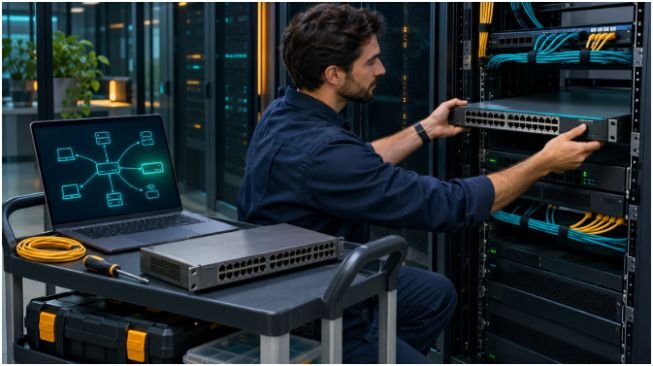
Accurate monitoring coverage depends on more than device reachability. Teams need to understand the relationships and state changes that explain why performance moved.
Configuration History Is Part Of Coverage
Configuration changes are often the difference between a clean signal and a confusing incident. If a device started behaving differently after a change, the ability to compare configuration history becomes operationally important, not just administrative.
Lumics supports configuration history tracking and visual comparisons so operators can review changes over time on a single device or compare configuration differences between two devices. That matters because the fastest path to root cause is often not another alert. It is a clear before-and-after view of what changed.
Dependencies Define What “Impact” Actually Means
A device can be healthy and still create downstream problems if something it supports is altered. That is why dependency mapping matters. Coverage accuracy is not just about seeing the device itself. It is about seeing how the device sits inside the service chain.
Lumics addresses this with dependency-aware mapping and multiple views of the environment. Topology, dependency, geographic, and logical perspectives give teams different ways to inspect the same underlying infrastructure. That means one change can be evaluated from several angles instead of forcing engineers to infer impact from a single diagram.
How Lumics Keeps Monitoring Useful As the Environment Moves

The best monitoring systems do not pretend the network is static. They are designed for environments where change is normal. Lumics takes that approach with a cloud-based model, native configuration management, and live mapping tied to current data.
That combination matters because it reduces the number of places where truth can drift. Instead of exporting device data into another tool and hoping the relationship stays current, teams can work from one system that reflects changing infrastructure more directly.
It also helps preserve operational continuity across mixed environments. Lumics supports multi-vendor infrastructure, including Cisco, Arista, Juniper, Fortinet, Palo Alto Networks, Dell, HPE, and VMware. That is important in real networks, where coverage is usually complicated by product diversity rather than simplicity.
For MSPs and internal IT teams, this is where the practical value shows up. Engineers do not want to spend their time maintaining the monitoring stack itself. They want accurate visibility, fast context, and enough depth to act without bouncing between disconnected systems. Lumics combines those functions in its monitoring platform.
The Operational Difference Between Seeing Data and Understanding Change
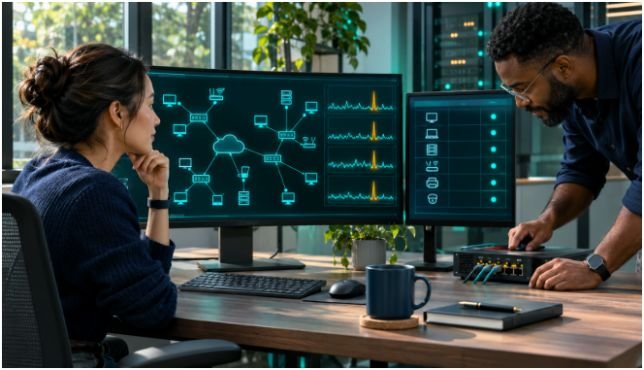
A lot of monitoring tools can tell you something is off. Fewer can show you why the picture changed in the first place. That distinction becomes critical when a network is in motion.
Faster Root Cause Starts With Better Comparisons
When coverage becomes stale, investigation time increases. Teams may know a device is abnormal, but they cannot tell whether the issue stems from an interface change, a dependency shift, or a broader performance pattern. Configuration comparison closes that gap by making drift visible.
In a practical scenario, a firewall may begin dropping traffic after a rule set adjustment. If the monitoring platform can show the prior configuration and the current state side by side, the team can narrow the search immediately. That does not replace engineering judgment. It simply removes unnecessary guesswork.
Historical Precision Matters More Than Rounded Trends
Another source of inaccurate coverage is data smoothing. If a platform averages away spikes, short bursts of congestion or latency may disappear from the record. That can make a quiet-looking chart misleading.
Lumics uses min/max graphing that shows actual performance spikes and bursts rather than masking them with averaged data. That matters in incident review because the difference between “no issue” and “brief but meaningful saturation” is often the difference between resolving the cause and chasing a symptom.
For operators, this is a major benefit of a modern network monitoring platform: the historical record stays faithful enough to support real analysis, not just summary reporting.
What Teams Should Demand When Coverage Has to Stay Accurate
A resilient monitoring strategy is less about feature count and more about whether the platform keeps truth intact as the environment evolves—especially as dynamic architectures shape the future of cloud computing. If a tool cannot support that, its dashboards will age faster than the infrastructure they describe.
A strong evaluation framework should ask whether the platform can do the following:
- Track configuration changes over time, not just current state.
- Compare two devices or two points in time without leaving the monitoring interface.
- Show dependencies clearly enough to explain downstream impact.
- Preserve historical performance data without smoothing away meaningful spikes.
- Reflect multiple infrastructure views, including topology and logical relationships.
- Support mixed vendor environments without creating separate monitoring silos.
- Keep reporting and mapping tied to live operational data.
This is where Lumics stands out strategically. It is not trying to be an oversized management suite that buries the signal under process overhead. It is built to keep the picture accurate while the environment keeps changing.
The Long-Term Advantage Is Lower Friction, Not Just Fewer Alerts
Accurate coverage is not only about incident response. It changes the day-to-day operating model—especially as multimodal ai drives deeper correlation across logs, metrics, and topology data. When monitoring reflects reality, teams spend less time validating whether the tool is wrong and more time solving the actual problem.
That shift matters over time. Better historical visibility improves trend analysis. Better dependency mapping reduces false assumptions. Better configuration comparison shortens investigations. And better performance detail helps teams distinguish a real degradation from a transient event that would otherwise be lost in averaged data.
In other words, the value is cumulative. The more dynamic the environment becomes, the more a precise platform pays off.
Lumics is designed for that kind of environment. It gives teams a practical way to keep coverage aligned with current infrastructure, so engineers can stay focused on engineering instead of monitoring administration.
If your environment changes often, the question is not whether you need monitoring. It is whether your monitoring still reflects the network you actually have today.